Website Heatmaps

The Ultimate Website Heatmap Tool to Optimize UX & Conversions
Visualize how users click, scroll, and navigate your website with Convirzon’s heatmap analytics.


Click, Move, Scroll – in High Def
Track every user interaction with pixel-perfect precision using our all-in-one website heatmap software. Visualize clicks, hovers, scrolls, and more – all in one unified view.
Filters That Dig Deep
Segment your heatmaps by device, traffic source, or campaign. With our powerful heatmapping tools, you’ll understand user behavior in full context – not just what happened, but why.
Frustration Detection Built In
Detect rage clicks, errors, and bounce behaviors with smart heatmap analytics. Know when something breaks UX – and how to fix it fast.
Discover our 7 different website heatmaps
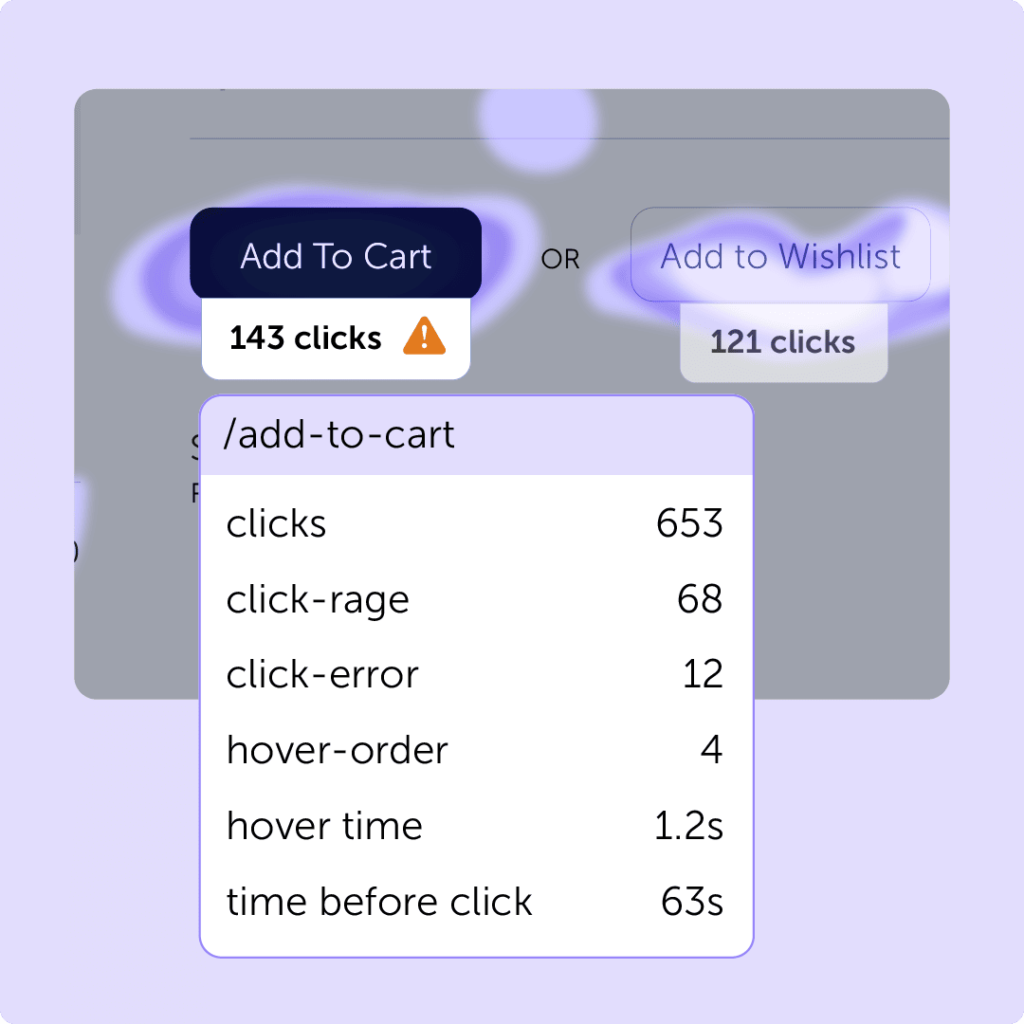
1. Click
Click heatmaps show where people actually click (or try to). Use them to see if your CTAs are working – or if users are getting sidetracked.
- Track clicks
- Analyse hovers
- Discover distractions
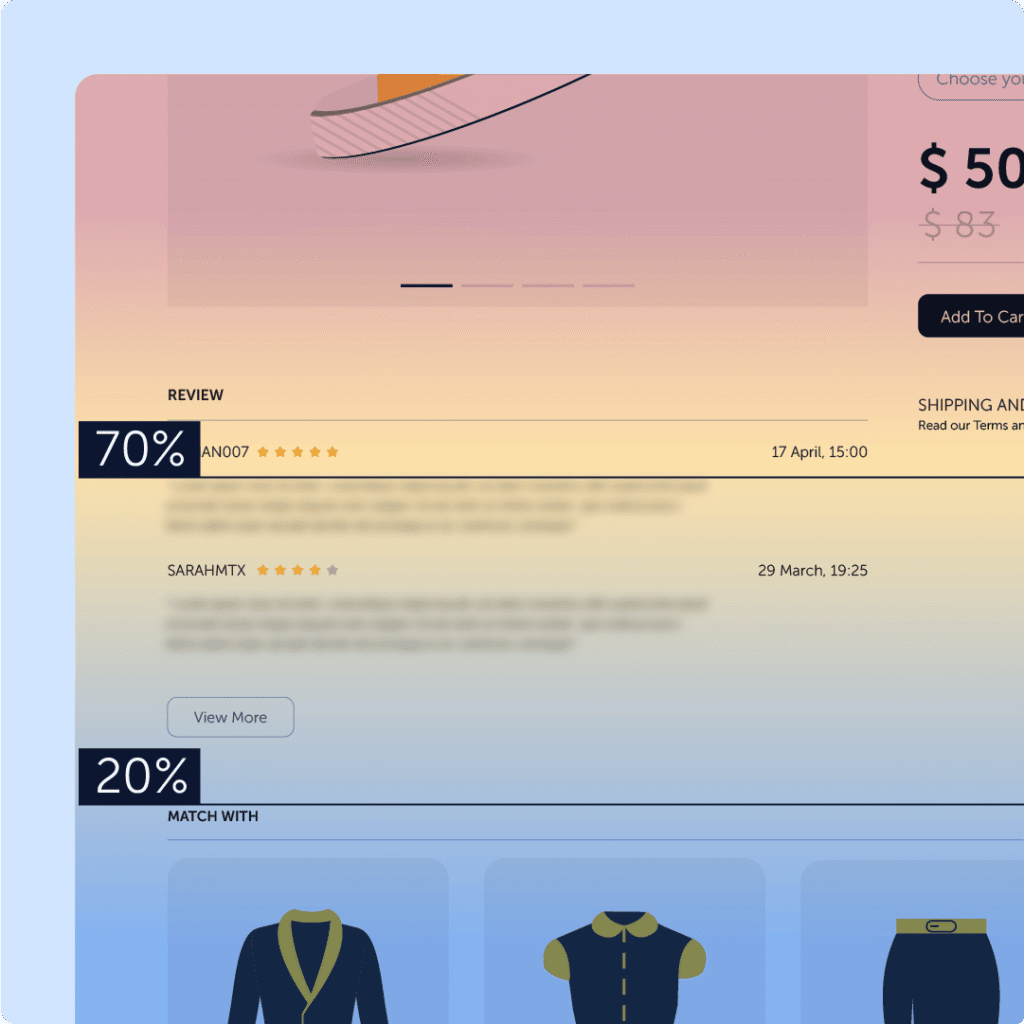
2. Scroll
See how far down users scroll. Find out if key content is seen or lost in the depths of your page.
- Measure content visibility
- Reorder for impact
- Spot drop-off points
3. Movement
Track where users linger and hover, even if they don’t click. A sneaky way to understand what grabs their attention.
- See hover patterns
- Understand hesitation
- Optimize placements
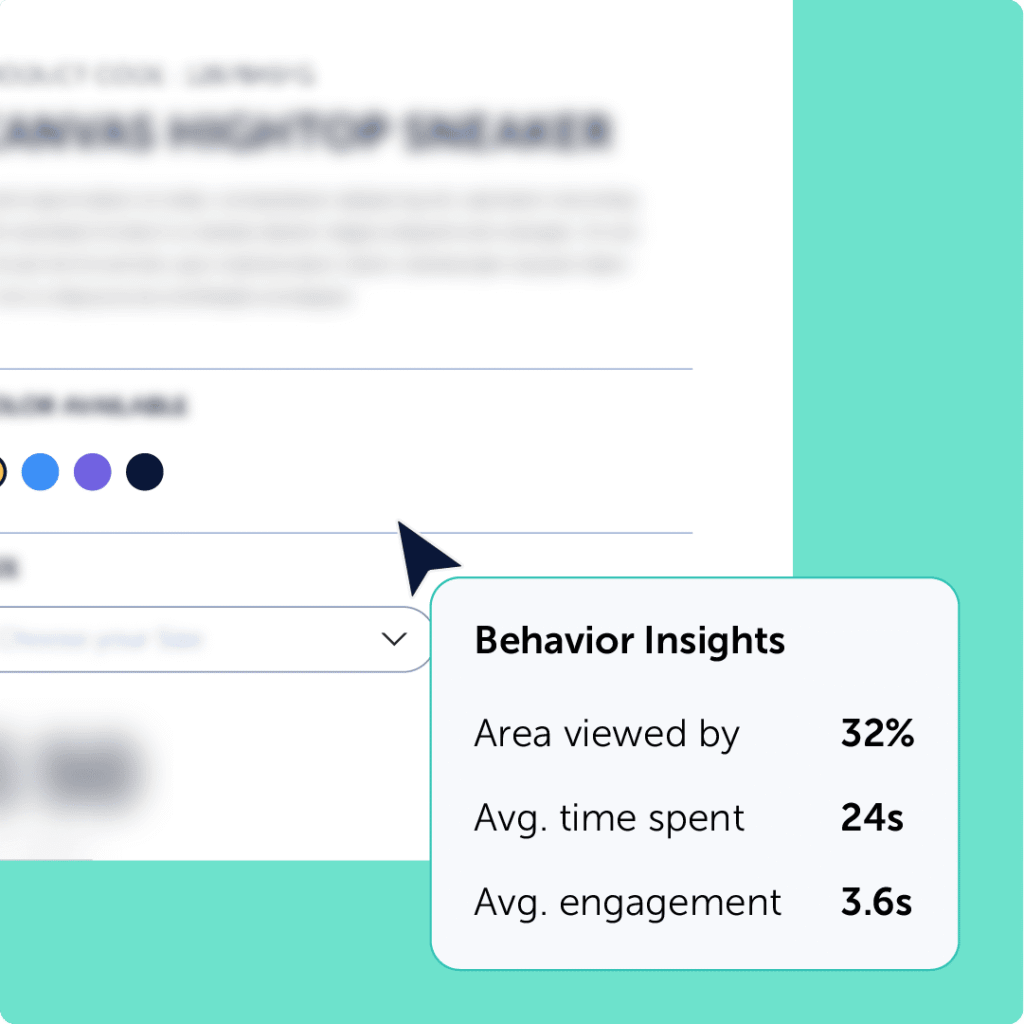
4. Attention
Blend clicks and scrolls to show where users are most engaged. Great for testing CTA spots or layout changes.
- Find high-engagement zones
- Prioritize visible content
- Guide better design choices
5. Friction
Catch where users rage-click, experience errors, or get stuck. Perfect for squashing bugs and smoothing journeys.
- Detect frustration points
- Surface UI blockers
- Streamline user paths

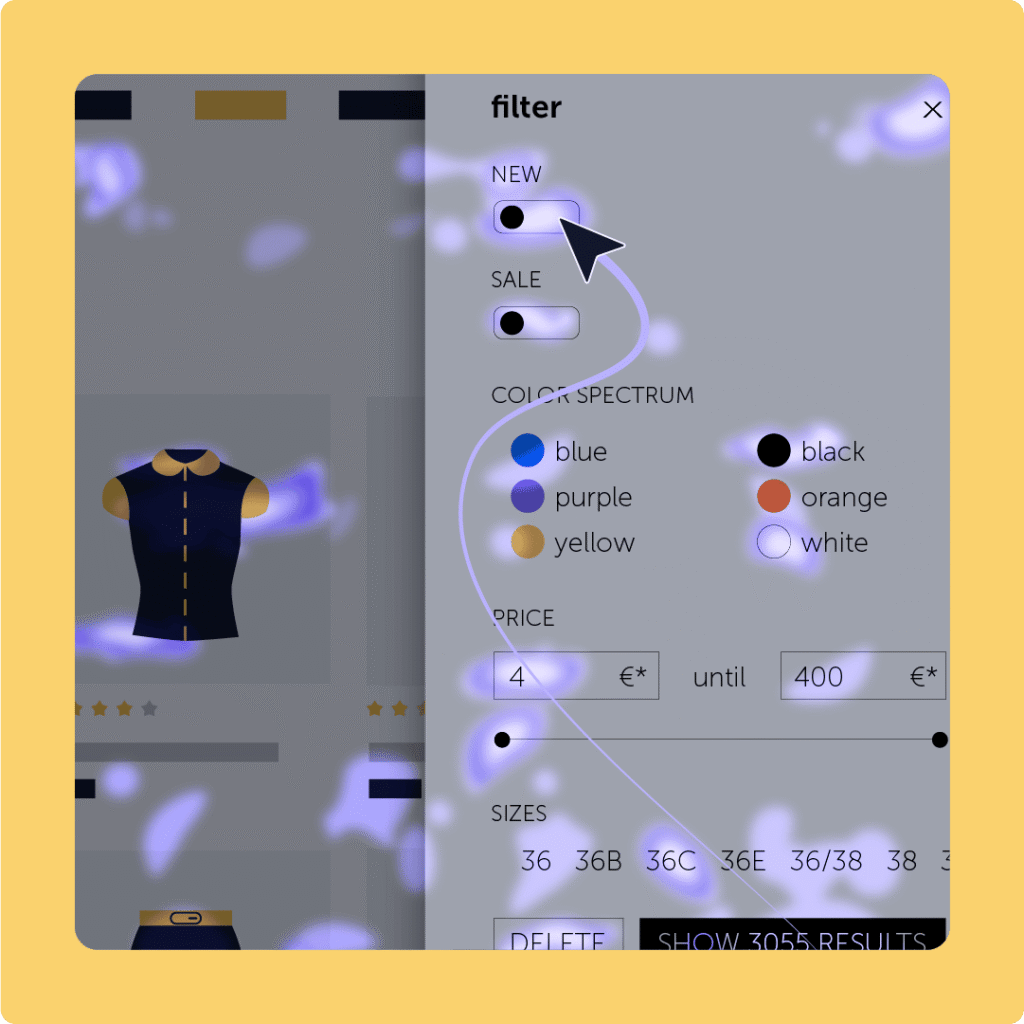
6. Interaction
See how users interact with menus, sliders, tabs – anything clickable. It’s insight beyond the basics.
- Track dynamic UI behavior
- Understand multi-layer clicks
- Improve UX elements

7. Geo
See where your users are in the world. Use it to localize content or sharpen ad targeting.
- Map user locations
- Target top regions
- Align content to geography

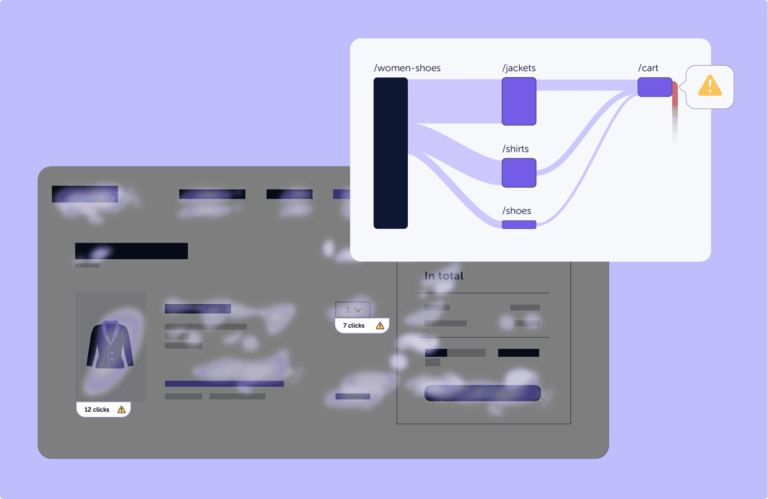
From Heatmaps to Journeys – All in One View
Don’t just analyze isolated clicks – combine our heatmap tools with our intuitive journey analytics to see how users actually move through your website. Track every scroll, rage click, and drop-off across the full experience. Our advanced heatmapping software helps you pinpoint where users struggle – and what to do about it.
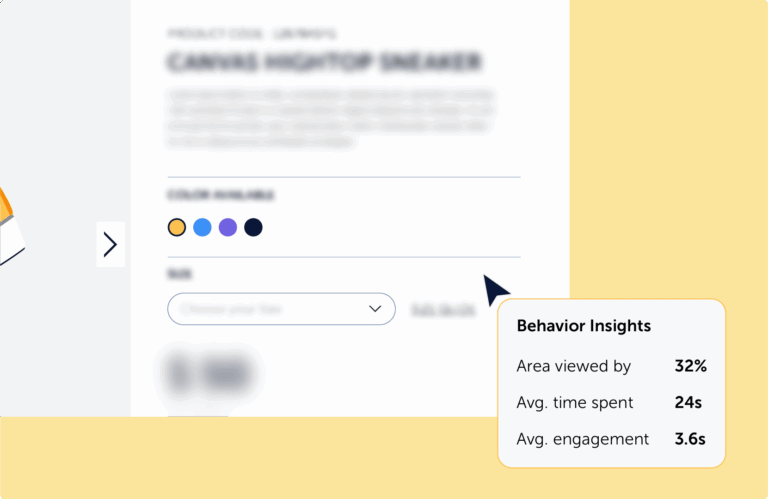
Make Every Pixel Count with UX Heatmap Analytics
Your landing page looks great – but are visitors really seeing what matters? With our heatmap software, you can track how far users scroll, where they stop, and what content gets ignored.
Whether it’s above the fold or deep down the page, our website heatmaps give you the clarity you need to design with purpose and optimize for engagement.
Pair that with Conversion Funnels, and you’ll finally connect behavior with results – not just pixels with guesses.
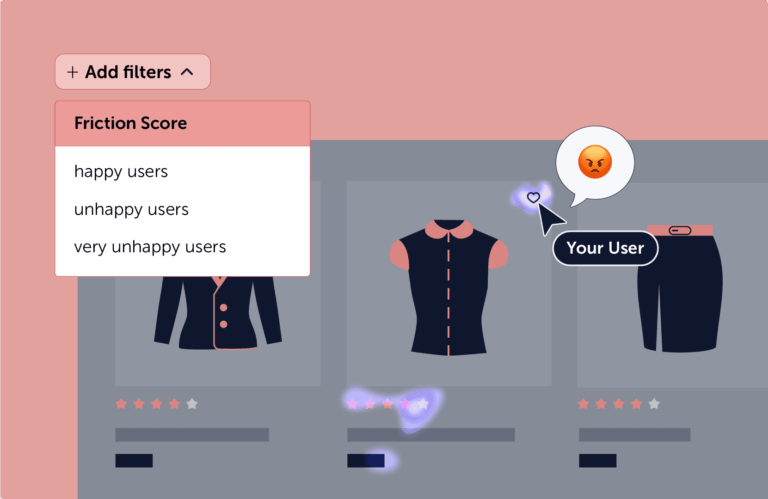
Find UX Issues Fast with Heatmap Analytics and Friction Detection
Thousands of sessions. Hundreds of pages. But where do you start?
Our heatmapping software automatically highlights where users rage-click, hesitate, or encounter errors – so you can skip the guesswork and fix what matters.
Our built-in friction detection finds unhappy users for you. Dive into the matching heatmaps to discover why — and turn frustration into conversion.
Get your website heatmaps today!
- Flexible Plans
- Full Compliance
- Excellent Support
Scalable plans for every stage, from targeted insights to full optimisation
Start Growing Your Business With Us

Gurjoban Bajwa
“I had some issues but Jai from management reached to me and promptly resolved the issue.."

Breanne Butler
“We’re very happy with Convirzon. They seem to work in the way that we do, and we have a close collaboration with them. Every day we talk to the developers and outline what needs to be done with our business promotion which help us alots.."

Henrik Loop
“The best website company in Canada exceeded our expectations! Their expertise and attention to detail transformed our online presence, boosting traffic and conversions. Their oporation center is in India and Karan the Project Manager for our business who is highly knowledgeable. Highly recommend their services for anyone serious about digital success.."